Windows packet capture

Ok, many moons went by since my last post. Also many things have happened, so I guess it was meant to be like this.

Anyhow, I’m back with a short, but useful blog.

One thing (ok, not one but quite a few) that Windows is missing when compare to Linux is packet capture tools. They used to have a very nice and powerful packet capturing tool called … I can’t remember, it is so old even Google deleted it from its caches.

But now days I guess most people install Wireshark on the Windows and, to be honest this is my prefer way of doing captures, but what if, for some reasons, we don’t have the comfort of using WS? We cannot download it or install it, we are forbidden to do so, we have concerns about traffic interruption while the drivers are installed, … I’m talking about servers, of course. So, what are our options?

We could go for WS portable version, which does not require installation, but in my recent troubleshootings it was proven not to work as expected.

Another try could be TCPDUMP for Windows. I did not try it, but looks like no installation needed, but it’s not free. There are many more options available, but they are not free, they need to be installed, they don’t work, they use their own file format, …

So, what’s left is, I guess plain old Windows netsh tool. Believe it or not, it can do a packet capture for us.

The scenario: we have a Windows server without packet capturing software and we need to do a tcpdump style troubleshooting. Let’s go…

First, we make sure that we don’t have already a running capture. Not sure what is going to happen if there was, but better check:

netsh trace show status

Fine, no captures are running. No we can start our new capture. It is good idea to put some basic capture filter, as we do with WS, so we can do:

netsh trace start capture=yes IPv4.Address=8.8.8.8

This is going to capture all packets to and from IP 8.8.8.8. We can also see what is the location of the capture file. I guess that we can tweak netsh parameters more, but for basic troubleshooting scenario, this will do. We can verify our capture status, but this output is ugly and the only usable info here is I guess status, which should be running:

netsh trace show status

Now we do our test. In this case, just ping Google server:

ping 8.8.8.8

Ok, we completed our test, and we should now stop our capture:

netsh trace stop

Again, we can see the file location. The file has ETL extension, which WS cannot open (as far as I know). If it could, we would have one less step to do, but still we have to capture packets as described above. The “netsh stop” can take some time, so don’t worry and just wait for it to finish.

Just in case we need to do more captures, it could be a good idea to copy and perhaps rename our last capture. After this, we need a way to convert this ETL file to PCAP format (again, if WS cannot do this). So we may use an easy tool called, guess how, etl2pcapng. It is free and don’t require any installation, so we can run it on the server or client PC:

We can see here two files. One is ETL, the one we need, and another one is CAB file that contains God knows what, and it is very large. For a most simple capture it can go for 90MB or more. So, we only need to transfer ETL file to our desktop for conversion or already converted PCAP file which we can open in WS:

Yes, it has more steps than we would like to, but if we don’t have WS on the server in question, I guess this can help out.

Thanks for reading. Stay safe and healthy!

Posted in Microsoft, Security, Windows | Tagged , , , , | Leave a comment

Firepower Threat Defense Active/Standby Failover

Cisco Firepower high availability is something we should take seriously into consideration when deploying the product. No production deployment should ever have a single device passing the traffic. With Cisco Firepower, we have several deployment options: we could have ASA 55xx-X devices running ASA code with Firepower services installed on the SSD drive and with the ASA redirecting desired traffic to the module. In this scenario, the failover is achieved on the ASA level and the Firepower software module is treated as any other ASA interface, which means that, when there is a problem with the Firepower software on the active ASA unit, the failover will occur and the traffic will flow through the standby unit, which becomes active now. The software in the standby module also begins passing traffic. This failover is long present with PIX/ASA and is described here.

Our second option for running Firepower is wiping the ASA code off from our 55xx-X devices and install the FTD software.

The third and final option is having new breed of hardware such as 21xx/41xx series and run the FTD code on them. We could, of course, run the ASA code on 21xx/41xx, but setting the failover on them is the same as with ASA55xx-X devices. Here we will deal with 21xx/41xx FTD failover.

First let’s see briefly requirements for failover (HA from now on). Both devices:

  • Are the same model
  • Have the same type of interfaces
  • Have the same number of interfaces
  • Are in the same domain and group
  • Are running the same version of software
  • Have normal health status
  • Both are in the same operational mode (routed/transparent)
  • Have the same NTP configuration
  • Are fully deployed with no uncommitted changes
  • Don’t have DHCP or PPPoE configured on any interface

Our devices should have a status similar to this:

Let’s assume that the primary unit is fully configured, tested and is passing the traffic. Before we begin creating the HA pair, we should make sure that everything is cabled correctly from the standby unit’s standpoint, the switch configuration is ok and so on. The standard HA configuration story. We should also enable two interfaces on both units. For example Ethernet1/11, which we will use for HA heartbeat and status messages and Ethernet1/12, which will be used for state tables replication. We could have only one link sharing these duties, but on these boxes we should expect lots of traffic, so separating these duties is probably a good idea. Let’s not forget to deploy our changes to both units, because if those interfaces are not enabled, the HA creation will fail:

When we have checked all the above, we begin setting our HA by clicking Devices->Device Management->Add->High Availability. We give this HA pair a name, select “Firepower Threat Defense” as device type and chose primary and secondary peer. This selection is very important, because the configuration from the primary peer overwrites that on the secondary peer. Then we click Continue:

The warning that pops up is self-explanatory. The Snort process will restart, which will cause the traffic outage on both units. In our case, the primary unit is in production and this process will cause the traffic interruption:

On the next dialog box we are given the opportunity to set up HA parameters, such as interfaces that will make HA tick, IP addresses, interface names and optional encryption of replicated traffic:

And the process of creating a HA pair begins:

We can watch the progress on the tasks or devices menu:

This could take some time and during that time we could see various warnings in our Health Center, but once the process completes, we should see all green and new logical object created. This object represent our new HA pair. We can also see that the policy on the standby unit is overwritten with the policy from the primary peer. We have to have the same policy on both peers:

This was basic setup. We could log into FTD or LINA engines with SSH and verify this failover is running correctly bu issuing “show failover” command that we used to know with the ASA failover setup. A sharp eye will catch that the secondary unit is in failed state. Excellent observation, we will see later why this is the case…

Now it is time to tweak this setup a little bit, by clicking edit or pencil icon of the HA object. The advanced setup window opens:

Here we can see that only one interface is monitored and that no interfaces have secondary IPs. We need to fix this. Also, perhaps it is a good idea not to leave default MAC addresses on the interfaces but rather specify our own. So, let’s do this from the current window.

First we enable monitoring of each interface and specify standby IP address, for example:

Now for each interface we specify active and standby MAC addresses. We should make sure that these addresses will never appear on our network. Perhaps a good idea would be using aaaa.bbbb.cccc, where aaaa.bbbb is static part and cccc might be something that will easily remind us of what interface we are dealing with. So, for example Port-channel2.1000 primary MAC could be aaaa.bbbb.1000 and secondary aaaa.bbbb.1001. In a similar fashion for Port-channel1.40 we could have aaaa.bbbb.0040 and aaaa.bbbb.0041. This is just a suggestion, because this step is optional and HA will work without this setting. It just makes life easier should one device fail and should be replaced:

So our MAC address settings part should look like this:

After applying our changes, we should have all green on our HA logical entity:

Because HA part is handled by the ASA or LINA engine, we can still use familiar trouble shooting commands from CLI:

Here we can see that the other unit has failed. This is because primary unit has RADIUS interface configured and the other unit does not. This was a test interface only needed on one unit for a limited period, we can disable monitoring of this interface and reapply our policies:

Now we should have a clear situation on both peers:


That is all for now. Hope this was useful. Thank you for reading.


Posted in FirePOWER, FireSight, Firewall, ftd, Security, Sourcefire | Tagged , , , | 1 Comment

A little bit about Firepower Network Analysis Policy (NAP)

We have previously talked about Intrusion Prevention Policy, or IPS, and saw how to configure and tweak the same. What we did not talk about and is closely tied to the IPS policy is Network Analysis Policy or NAP. So, what is NAP? The NAP is sort-of-kind-of-pre-IPS-policy. What I mean by this awkward construction? Well, the Snort (and all other IPS systems, for that matter) uses pattern matching technique to find and prevent exploits in network packets. Whether it is a simple string comparison or more complex regex match, it is still a pattern matching. In order to do this, Snort engine needs network packets to be prepared, if you will, in a such way that this comparison can be done. This process is done with the help of NAP and can undergo a three stages which help each other and Snort at the end:

  • Decoding
  • Normalizing
  • Preprocessing

Each part plays a critical role in making sure that packet is sane and can be used by Snort rules and all of them are glued together with the NAP. How the NAP works? Basically, a network analysis policy processes packet in phases: first the system decodes packets through the first three TCP/IP layers, then continues with normalizing, preprocessing, and detecting protocol anomalies. From the Cisco’s documentation:

  • The packet decoder converts packet headers and payloads into a format that can be easily used by the preprocessors and later, intrusion rules. Each layer of the TCP/IP stack is decoded in turn, beginning with the data link layer and continuing through the network and transport layers. The packet decoder also detects various anomalous behaviors in packet headers.
  • In inline deployments, the inline normalization preprocessor reformats (normalizes) traffic to minimize the chances of attackers evading detection. It prepares packets for examination by other preprocessors and intrusion rules, and helps ensure that the packets the system processes are the same as the packets received by the hosts on your network.
  • Various network and transport layers preprocessors detect attacks that exploit IP fragmentation, perform checksum validation, and perform TCP and UDP session preprocessing.
  • Various application-layer protocol decoders normalize specific types of packet data into formats that the intrusion rules engine can analyze. Normalizing application-layer protocol encodings allows the system to effectively apply the same content-related intrusion rules to packets whose data is represented differently, and to obtain meaningful results.
  • The Modbus and DNP3 SCADA preprocessors detect traffic anomalies and provide data to intrusion rules. Supervisory Control and Data Acquisition (SCADA) protocols monitor, control, and acquire data from industrial, infrastructure, and facility processes such as manufacturing, production, water treatment, electric power distribution, airport and shipping systems, and so on.
  • Several preprocessors allow you to detect specific threats, such as Back Orifice, portscans, SYN floods and other rate-based attacks.
  • The sensitive data preprocessor detects sensitive data such as credit card numbers and Social Security numbers in ASCII text, in intrusion policies.

Now that we know a little bit about NAP, how do we configure one? Stay tuned, there is a big surprise down the road…

This is the screen shot of the advanced settings of our Access Control Policy, or ACP. We can see what IPS policy we are using, what variable set is tied to that policy and finally what is our Network Analysis Policy. When we configured the ACP and IPS, we never actually did anything with regard to the NAP. Why is so? Well, there is default NAP that is tied to the ACP and most people think that the default settings are good for most deployments and that we should stick to these default settings. We could not be more wrong! Default NAP is almost never ok for anybody if used as-is. Why? Read on…

When we create an Access Control Policy, by default it is tied to the “Balanced Security and Connectivity” NAP, which can be viewed in advanced settings of ACP:

Creating our custom NAP is a little bit tricky. Maybe the better description is “it is hard to find NAP policies”. They can be reached by going to “Policies->Access Control->Network Access Policy” (it is hard to find, located at the top right corner):

The creation of NAP is similar to the creation of IPS policy. We begin creation of policy by choosing the NAP policy template:

On new systems we can chose among four templates:

  1. Connectivity Over Security
  2. Balanced Security and Connectivity
  3. Security Over Connectivity
  4. Maximum Detection

My advice: it is best to use “Balanced Security and Connectivity”. It is recommended template and is perfectly fine with almost every organization. Don’t go above that and never, I mean never-ever use “Maximum Detection”. At least in a production environment.

In system that is being used for some time, we can create our new NAP based upon other NAPs, which are, in turn, based upon one of those four base NAPs.

When we create our NAP, we can point our Access Control Policy to use this NAP, by going to ACP’s advanced settings. Isn’t this what we all do? Yes. And is there anything wrong with this approach? Yes. So, what is wrong?

After we select our base policy, we have the opportunity to edit this NAP.  Settings are different here that with IPS policy, but the principle of inheritance that we talked about earlier stays the same: settings in our layer called “My Changes” takes precedence over the same settings in basic layer “Balanced Security and Connectivity” (given that we opt to use the recommended base policy):

We won’t get into details about these settings now. It is important to understand that settings given here help Firepower detect attacks efficiently and prevent IPS evasion techniques, such as encoding, IP Fragmentation, overlapping fragments, protocol ambiguities, resource exhaustion, TTL manipulation and so on.

Let’s go back to the beginning of this blog and refresh our knowledge about that pattern matching that IPS engine does and how the network packet is prepared for this process (decoding, normalizing, preprocesing). Now, let’s imagine that the malicious user is crafting his attack by using one or more evasion techniques to beat our IPS and compromise his targets, our internal resources. The purpose of NAP is to defeat attacker’s efforts so that it prepares or changes packets in such a way that IPS policy can act upon this traffic. It is known fact that different operating systems do packet reassembly different way. To be effective, IPS must prepare network packets in much the same way as the resource it protects would do. So, if we are protecting Linux systems, we prepare the traffic in one way and for Windows systems, we do that another way. By ‘we’ I mean IPS.

So, one of the most important things with NAP is to tell it how to normalize or prepare network traffic for analysis. Not many things should be changed here, but one of them is certainly “IP Defragmentation”:

So, this part of NAP is saying “I’m protecting Windows targets”. Like Windows targets can be protected 😀

This setting is ok if we really have only Windows hosts, but that is almost never the case. This does not mean that Linux or other hosts are not going to be protected, but they won’t be protected efficiently or some attacks may be missed. We need to tweak this setting a bit, in order for Snort to see our topology more clearly. For example, if we had Linux servers in the network segment 10.1.10.0/24, we would adjust the settings accordingly:

So the NAP would know how to protect our Linux servers (we added them manually), as well as Windows servers (they fall under the default targets). Of course, no network segment contains only Windows or Linux hosts, so we could tweak our policy further:

Here is our Cisco switch SVI interface in the middle of Linux network segment and NAP now knows how to differentiate it.

Another place inside Network Analysis Policy where we should do similar tweaking is “TCP Stream Configuration”. Here we can apply the same principles as with “IP Defragmentation”. Again, the system by default has a wrong assumption, so we tell it to be smarter:

We can see that we can be even more precise when choosing an operating system type. If our operating system is not listed, we should go for closest match. For example, we have “Windows 2003” listed, but no “Windows 2012” or “Windows 2016”. Or we could have Linux kernel 3.x, but only 2.x option to select. Chances are that “Windows 2016”, for example, handles network packets similar to “Windows 2003”, or Linux 3.x similar to Linux 2.x.

Among other NAP settings, perhaps “Inline Normalization” should be mentioned here and turned on. Settings->Transport/Network Layer Preprocessor:

Let’s not forget to save our NAP, refer access control policy to it and deploy our settings to devices.

Now, our NAP policy will work for us as it should. Of course, there is one small caveat here. Our NAP policy is “one size fits all”, which means that we only have one NAP with different settings for various network segments. What if we would want to have multiple NAP policies and tie them to individual segments? We could that. Under access control policy’s advanced settings we chose “Network Analysis and Intrusion Policies” pencil icon and click “No Custom Rules”. Here we can select our networks and assign separate NAP to each one, and left default NAP handle the rest of the hosts:

Final thoughts: there are tons of settings inside the NAP. Changind these settings are considered advanced IPS tweaking and should not be taken lightly. We must know exactly what we are doing and with NAP it requires lots of research. Otherwise things may be broken.


I hope this was useful for you guys and hope to see you soon.

Thanks for sticking around!


Posted in Cisco, FirePOWER, FireSight, IPS, Security, Sourcefire, Uncategorized | Tagged , , , , | Leave a comment

Resetting admin password on Cisco Sourcefire module

If we forgot a password for the user admin on our SFR module, we will find ourselves in a problem, sooner or later. We don’t have to know this password in a regular operations, but for troubleshooting purposes, we cannot live without it. So, as long as we have access to our ASA firewall, the procedure is straight forward.

From the ASA we issue a command:

session sfr do password-reset

It is as simple as this.

Now, some articles say that this does not work. Well, it does, but we have to have in mind that this sets admin password to the platform default, which on 6.2.0 is Admin123. For other platforms it could be something else, so this is something we have to have in mind. What is the default password can be found in the documentation.

Once we have a password set to the default, we need to set something that works for us. We need to connect to the SFR console session and change the password:

webvpn-BN-DR/sec/actNoFailover#
webvpn-BN-DR/sec/actNoFailover# session sfr console
Opening console session with module sfr.
Connected to module sfr. Escape character sequence is ‘CTRL-^X’.

Authorized users only! Any access to this system is monitored!
sfr-bn-DR login: admin
Password: Admin123 (not displayed while typing)
>

> configure password

Enter current password: Admin123
Enter new password:
Confirm new password:

>

And now we can log in to the module through the ASA or directly via SSH.

If this does not work for some reason, we can re-image the module. Here we can find out how.


Thanks for reading.


Posted in ASA, Cisco, FirePOWER, FireSight, Security, Sourcefire | Tagged , , , , | 3 Comments

DNS Sinkhole with Sourcefire

There is this nice feature with Cisco Firepower called DNS Intelligence. This feature allows us  to have a huge database containing known bad domain names and utilize that database to drop connections to IPs represented by those names. We can have these names in form of some feed provided by Cisco or some other vendor, for free or as a payed service, or it could be created by us. What ever case may be, the point here is the same: we want to drop connections based on the result of the DNS query. One good example would be C2 or Command-and-Control connections. If one of our PCs caught some malware and that malware is trying to call home using known bad DNS, we can detect and prevent it. More on how DNS intelligence works can be found here.

Let’s see one typical scenario. The usual  query looks like this:

So, client asks for the IP of a given name (1), if the name is not malicious, the SFR passes the query to the public DNS servers  (2). The chosen DNS server returns the answer (3) which SFR passes on to the client (4). Now client connects to the returned IP address, with the HTTP(s) or any other protocol.

If a request contains a malicious domain, then the SFR could return a sinkhole IP address, if instructed to do so, of course:

The steps are almost identical. The only difference is that the SFR recognizes that the requested DNS name is malicious and returns the sinkhole IP address instead of real IP. Now the client connects to the sinkhole address of 5.x.y.133 and can be easily tracked and identified as infected. The site in question is by no means malicious, but rather an example for testing purposes.

Now comes a second scenario:

The query flow is similar, but instead of asking public DNS server directly, the infected PC is asking our private DNS servers for address (1) and our DNS server in turn asks public DNS servers (2). If the name is not malicious, SFR will pass the request to the Internet (3) and the resolved IP address will be returned to the client (4), (5) and (6).

If the requested name is malicious, then in step (5) the SFR will return the IP address of the sinkhole object and our private DNS server will just pass this info to the client (6):

Now the client connects to the sinkhole IP and we got it logged on the FMC.

There are two issues with the second scenario: because the SFR is seeing a malicious request coming from our DNS server (2), it will mark DNS server as being possessed by a malware, which clearly is not the case. So, two not so good things are happening here: first, our DNS server (and probably a domain controller) is marked with “Indication of Compromise” flag, and second, there is no way of telling which PC is actually infected. This is where DNS Sinkhole action comes into play. It fixes the second issue, so we can track infected clients. I am afraid that the DNS servers will always be marked with an indication of compromise flag, but we can treat these events as a false positive, given that we know what we are doing.

The sinkhole is nothing more than an IP address that the SFR will return for DNS queries made either by clients directly or via internal DNS server. This can be fake, non used address or it can be an IP address of real server. The important thing is that the address *must* be “outside” of the network, or should I say in a place in our organization so when the query that client sends to this address actually goes *through* the SFR. This is important because this way the SFR can catch follow-ups connections made by our clients after DNS queries. I mean real HTTP/HTTPs or other connection types. If the IP address is bogus, then we can filter out all events on SFR with the destination IP of sinkhole object and associated source IPs are actually our infected PCs. If the IP address is real, that is we have a server on that IP, we can have more data collected on that server to do deeper investigation. Makes sense?

We already know how DNS policy works, how we configure it and where we attach it. Now we are going to alter our policy in this way: we will create a list of DNS names we want to sinkhole. Then we will create a sinkhole object. Finally we will create a DNS policy rule that will return a sinkhole object address for any query sent for names from the list we created.

First, let’s create our list. “Objects->Object Management->Security Intelligence->DNS Lists and Feeds”. We click “Add DNS Lists and Feeds“. We give this list a name, select type and browse to the file. This file contains DNS names we would like to sinkhole, one name in one line. Never mind the path that is displayed that contains “fakepath“. Then we upload the file and click Save.

Now we create a sinkhole object. Like said previously, this can be fake IP or the address of a real server that will be collecting additional data that comes from our infected clients. The IP address must be routable in a way that actual connection from infected PC to this address passes through the SFR. Also, the IPv6 address is mandatory. We are not using IPv6, so it does not matter what we put here as long as it is a valid address.

Creating a sinkhole object is done via tree option “Sinkhole” under object management:

We give it a name, IPv4, IPv6 addresses, select if we want just to log or log and drop follow-up connections to the sinkhole address. Optionally we can set a type which will be logged on the FMC. This screen shot depicts IP address of 1.1.1.1. This is just an example. We will actually use here an IP address of 5.x.y.133.

Now we need to modify our existing DNS policy to include a rule that will only trigger if the request is coming from specific IPs and contains a specific query. This is for testing purposes of course, because we don’t want to affect the entire organization. Once we have tested this, we can remove source IP filter and expand our list, or even include some feed.

So, our tabs should be filled like this:

And our rule should be positioned at the right place inside the DNS policy, because the rules are evaluated from top to bottom:

Now we must save changes and apply access control policy.

After policy is applied, it is time for testing. First, scenario in which clients asks public DNS servers directly:

Clearly the our SFR returned a sinkhole object. This can be verified under “Analysis->Connection->Security Intelligence Events“:

If we now browse to the wanted site we are actually going to go to the 5.x.y.133. This will be logged and if we had something listening on this IP, we could also have packets captured on that server.

So far, everything was hunky-dory. Now, if we try all this with our internal DNS servers, we get an unexpected result:

This is where all the fun begins. According to Cisco’s documentation, DNS inspection on the ASA firewall can interfere with the normal sinkhole operations. So, they recommend to turn this feature off:

asa(config)# policy-map global_policy
asa(config-pmap)# class inspection_default
asa(config-pmap-c)# no inspect dns preset_dns_map

This did not help! So, some smart people from Cisco suggested that yet another feature should be turned off – “DNS Guard“. So, plain and simple:

asa(config)# no dns-guard


No luck here as well!

Before we move on, I should stress out that one should read and understand about turning these features off because that way overall security may actually be lowered. I did not investigate upon this, but we should have this in mind. Anyhow, turning these features off did not help. Finally, there is documented bug for Cisco Sourcefire 6.0.1 and 6.1.0 – “DNS Sinkhole does not work with EDNS” (bugID: CSCvb99851). It says that Windows 2012R2 DNS server can cause issues with Sourcefire by using some extended attributes in queries it sends and those attributes are tough to be processed by Sourcefire. This attribute or extension is marked as EDNS0 and allows Windows DNS server to send UDP packets larger than 512 bytes. I don’t think this is the case, because I have turned off DNS packet size checking policy on the ASA. I think this is something only Microsoft DNS servers understand or use. Anyhow, we just turned off features on ASA that blocks larger DNS queries, and our SFR version is 6.2.0, so this should really not be an issue, but let’s give it a try…

The feature is turned off on Windows 2012 R2 DNS server by running this command:

dnscmd /config /enableednsprobes 0

This modification should disable the extension in question. The success message should be displayed:

Registry property enableednsprobes successfully reset.
Command completed successfully.

Now again, please read about implications on your environment if turning this feature off. I have came across some users complaining that after some time, the changed value reverts itself back to original and again breaks our sinkhole operations.

I took another approach and changed the registry myself. On Windows 2012 R2 Server registry key actually does not exist. The branch in question is:

HKEY_LOCAL_MACHINE\System\CurrentControlSet\Services\DNS\Parameters\

and key value is

EnableEDNSProbes

So, we need to add this key with a value of zero:

After this change, we must restart our DNS service.

Let’s now try to resolve our test domain name and see if we will get a sinkhole object back:

We are using different names for testing, because our clients and DNS servers cache results, so if previous test did not come up as we expected, we could fail over and over again because the response was cached.

As we can see, we are now asking our internal DNS server and are getting a real sinkole IP address. Now it it easy to identify all PCs infected with some sort of malware. We need to check our logs on FMC by looking for a destination IP address of our sinkhole object and whatever IP addresses we find in the source column, those are infected machines:


An useful concept, actually easy to explain but somehow hard to implement. Not any more 🙂

Thanks for reading.


Posted in Cisco, FirePOWER, FireSight, IPS, Security, Sourcefire | Tagged , , , , , , | 2 Comments

Packet capture with Sourcefire CLI

This one will be short 🙂

If we need for some reason to do a packet capture on Cisco Sourcefire/Firepower we can do that from the CLI.

Let’s say that we have issues in communication from IP 10.0.0.3 to Google name server 8.8.8.8. On ASA it looks good, but we still have issues. Sure, we can try sifting through the FMC events, but where is the fun in that 🙂

So, we need to log in to the SFR module with SSH:

login as: admin
Using keyboard-interactive authentication.
Password:
Last login: Fri Mar 17 17:54:28 2017 from pop-ssd.popravak.local

Copyright 2004-2017, Cisco and/or its affiliates. All rights reserved.
Cisco is a registered trademark of Cisco Systems, Inc.
All other trademarks are property of their respective owners.

Cisco Fire Linux OS v6.2.0 (build 42)
Cisco ASA5525 v6.2.0 (build 362)

>

Here we can direct a packet capture to the screen, which is not recommended, especially if we don’t use filters, or we can direct a capture to the file, which can be later viewed with tcpdump or Wireshark. So, let’s do both…

First, we capture to the console with:

> system support capture-traffic

But before we actually try to resolve some names, we first prepare SFR with right options and filter:

It is important to select domain for capture “2 – Single Context” (at least in my case) and after the Options: we should specify our filter, as depicted above. Now we try to resolve some name:

And on the SFR we have the expected result:

The capture options are in the tcpdump format, so it is possible to redirect the output to the file by using “-w filename.pcap” option, like this:

It is important to state “-w filename.pcapbefore the capture filter, otherwise it won’t work:

Now, it may be possible to view this file from this mode, but I feel more confident doing this from expert mode. The file captured is located in “/var/common/” folder. We can view it by using tcpdump command:

Finally, we can transfer the file from the SFR to something with Wireshark, for better viewing experience. First, we list files:

Then we transfer them using FTP or SCP. In this example we are using FTP server:

And by the way, we interrupt the packet capture with CTRL-C.


Ok, that’s all for now. Thanks for reading.


Posted in Cisco, FirePOWER, IPS, Security, Sourcefire | Tagged , , | Leave a comment

Upgrade Cisco Sourcefire to 6.2.0

12

Ok, first of all apologies to all of you guys for being away so long, I was very busy. Still am, but I have recently completed an upgrade of the Sourcefire system to version 6.2.0, so I thought to share my experience with you…

First things first. I strongly recommend to check out our article about upgrade from 5.3.x to 5.4.x and upgrade from 5.4 to 6.0. Many things said there actually apply to this article.

Our starting point is 6.0.1 on both FMC (Firepower Management Center) and four modules on ASA5525-X running 9.4(2) code. At the end of this article, we are going to run 6.2.0 on FMC and modules and ASA will run 9.7.1

As with previous upgrade, we cannot just hop from 6.0.1 to 6.2.0. As with the ASA upgrade, we also have to be careful and follow required steps. We cannot (in most cases) skip from one version to the latest. One another important thing to mention is that we have to make sure that ASA software version is aligned with the SFR module version. So, we must upgrade ASA code before SFR code, and we have to upgrade FMC before we upgrade SFR code. Makes sense? So, in summary, these are the major steps we will follow:

  • Upgrade ASA code from 9.4(2) to 9.7.1
  • Upgrade FMC from 6.0.1 to 6.2.0
  • Upgrade two SFR modules from 6.0.1 to 6.2.0
  • Reimage remaining two modules to 6.2.0

One could ask, why upgrading two modules and reimaging another two? Well, just to show that we have options here. There could be several version in a path from current module version to the newest. If there is one or two, it may be good idea to do the upgrade process. However, there could be many versions and it may be quicker to reimage the modules to the latest release.

Here what needs to be done in a little bit more details:

  • Check upgrade paths and read release notes
  • Download all required images and verify hashes
  • Upload ASA and ASDM images to ASA boxes
  • Upload FMC and module images to the management center
  • Upgrade ASA boxes
  • Apply policies to the modules and check the overall health
  • Make backup of FMC or/and make a snapshot if running virtual
  • Upgrade FMC by following array of versions
  • Upgrade or reimage SFR modules
  • Reapply policies and check health


Upgrade ASA code to 9.7.1

Like said previously, we cannot go from version X to version Y just by removing old image and booting new one. Here is the upgrade path to version 9.7.1 at the time of this writing:

asa-upgrade-path

If we check this table, we can see that we can safely go straight from 9.4(2) to 9.7.1. If we were not this lucky, then we have to go from one version to latest one by doing the upgrade in several steps. We can refresh our knowledge about upgrading the ASA code here. One question remains unanswered so far and that is why 9.7.1? Well, this is why:

sfr-supported-platforms


Upgrade FMC to 6.1.0

Also with the FMC we cannot just skip to the latest version. Here is the table illustrating our upgrade path:

1

As we are at 6.0.1, we need to follow these upgrade steps to reach 6.2.0: 6.0.1 -> 6.1.0 Pre-Install -> 6.1.0 -> 6.1.0 Hotfix -> 6.2.0. For that purpose we need to obtain, upload and run the following images in the given order:

2

Some upgrades require reboot and others don’t. Anyhow, when we verify that this is actually what we want to do and we click the install button, the process will begin. It is very important to be patient here and not to interrupt the process. This WILL take a lot of time, for example:

appliance-rebooting-one-hour

So, don’t panic! If we planned all well, all will do well. It is important to know that no traffic interruption will occur while we upgrade the FMC, so we can stay cool.

Once we upgrade to 6.1.0, we have the option to do an upgrade readiness check, so if we are not ready, the check will tell us. Here we can run readiness check or go directly to upgrade:

3

4

5

We could also get a fail result from the readiness check, for example:

6

Here we can see a log file which we need to check out in order to find what went wrong. In this example, we find the main upgrade log file (main_upgrade_script.log), list its contents and see which upgrade script has failed:

7

As we can see, the script called “000_start/108_check_sensors_ver.pl” has failed. If we take a look at the log file for that script, we can see a reason it failed. By the way, the log file is named after the script name by appending .log extension:

8

So, we cannot upgrade FMC to 6.2.0, while we have modules running 6.0.1. They have to be at least 6.1. Once again, it is very important to make note of the upgrade paths. For ASA, FMC and modules.

At this point it is clear that we need to upgrade modules to at least 6.1 in order to upgrade FMC furhter. So, once we are at 6.1 with management center, we need to make modules running 6.1 as well. Once two modules are at 6.1, we will proceed with management center upgrade to 6.2 and then upgrade those two remaining modules to 6.2 as well. Stay with me here, we will upgrade two of four modules, the remaining two modules we will reimage. But if we don’t want to follow upgrade path for those two modules, we won’t be able to upgrade FMC. Because of that, we will remove those two modules from the FMC, upgrade FMC to 6.2, upgrade first two modules to 6.2 and then reimage remaining modules and reattach them to the management center.


Upgrade SFR modules to 6.1.0

We have already saw how modules are upgraded in previous article. Going from that article to 6.2.0 requires certain upgrade path, as follows:

9

As we can see, the upgrade path is the same as with FMC. Here I clearly marked that this hotfix needs to be installed after upgrading to 6.1.0.

Upgrading modules sometimes will require reboots and if reboot happens the traffic flow will stop, so we have to have this in mind. Either we plan for the downtime or we stop sending the traffic from ASA to the module until upgrade is completed.

These are images we will install:

10

Of course, the last step will be performed after management center is at version 6.2.0.

As per two previous images, we need to install the following versions:

  1. Cisco_Network_Sensor_6.1.0_Pre-install-6.0.1.999-30.sh
  2. Cisco_Network_Sensor_Upgrade-6.1.0-330.sh
  3. Cisco_Network_Sensor_Hotfix_AF-6.1.0.2-1.sh


Upgrade FMC to 6.2.0

There is not much really here different from the steps we took so far. We select appropriate upgrade, do a readiness check and finally upgrade to 6.2.0. Once we have a success upgrade, the message pops up:

fmc-6-2-0-upgrade-success

We reapply policies and check system health. If we are ok we proceed to….

Upgrade SFR modules to 6.2.0

Again, not much special here. If we followed all right paths up to here, then this step is an easy one. Readiness check, planned downtime or stopping the traffic to go through the module, reboot, policy reapply and health check.


Reimaging modules

This is fun 🙂

Not that all other stuff is not, but this is something we did not cover on this blog so far. The last two modules are in A/S firewall cluster. So far we have upgraded first two nodes to 9.7.1, similar to instructions given here. Now the plan is to reimage standby unit while the active is passing the traffic. After we reimage the standby module and reattach it to the management center, we make current standby ASA active, do the same with the other ASA and optionally we switch back that last ASA to be primary again. All with no traffic interruption.

First, we upload SFR boot images to both firewall nodes. We don’t upload system images, because we will pick them up from FTP server in the process.

Before we wipe modules clean, we may make a note about their network settings, so we can set them in correct state after we do reimaging. From the ASA command line interface:

11

Uploading boot images:

copy ftp://ftpuser:password@10.x.y.1/asasfr-5500x-boot-6.2.0-2.img disk0:

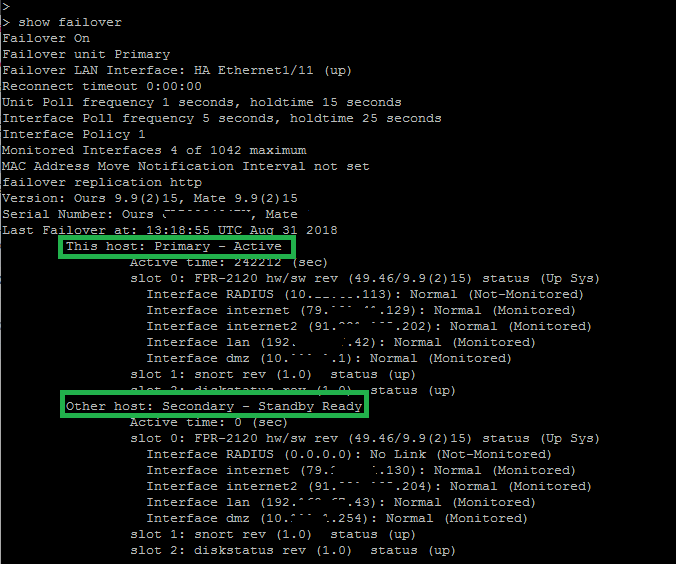
Before we begin, it is good idea to verify the failover status. We don’t want to reimage the software on one ASA if the other one is in a bad shape. Now we shutdown the module:

asa/sec/stby#
asa/sec/stby# sw-module module sfr shutdown

Shutdown module sfr? [confirm]
Shutdown issued for module sfr.
asa/sec/stby#

By issuing “show module sfr details” we confirm that the module status is down, and we remove the module:

asa/sec/stby#
asa/sec/stby# sw-module module sfr uninstall

Module sfr will be uninstalled. This will completely remove the disk image assocated with the sw-module including any configuration that existed within it.

Uninstall module sfr? [confirm]
Uninstall issued for module sfr.
asa/sec/stby#

After a while, the status of the module should be “Down No Image Present”. In order to install a new image, we need to point to new boot image:

asa/sec/stby#
asa/sec/stby#
asa/sec/stby# sw-module module sfr recover configure image disk0:/asasfr-5500x-boot-6.2.0-2.img
asa/sec/stby#

Of course, that command is typed in one line 🙂

We then boot the image:

asa/sec/stby#
asa/sec/stby# sw-module module sfr recover boot

Module sfr will be recovered. This may erase all configuration and all data
on that device and attempt to download/install a new image for it. This may take
several minutes.

Recover module sfr? [confirm]

asa/sec/stby#

The only solid reason for booting this image is to set up temporary network parameters to be able to fetch the system image and begin the software installation. We can see the interaction in the article Installing Cisco ASA FirePOWER software module. There is one difference here. In above mentioned article, the credentials for configuring module in the second stage were “admin/Sourcefire” and now they are “admin/Admin123“.

After the boot module setup is complete we will be presented with the basic prompt from which we can start download and installation of the system image, the application itself:

system install ftp://10.x.y.1/asasfr-sys-6.2.0-362.pkg

Once the download and installation is completed, we need to reattach the module to the FMC:

>
> configure manager add 10.a.b.67 somepassword
Manager successfully configured.

Finally, we go to the management center and add this module. We know how to that from this article.

We are not done yet. Because we removed this module from FMC, after we attach it back on, we need to license the module, reassign interfaces to appropriate zones and reapply policies. If all is ok, and the health is all green, we make this ASA active, so this module begin passing the traffic and do the same process for the other module.

At this point, we have our FMC and all four modules at 6.2.0 🙂

Final note: I did my best to make steps in this article error free. This did the trick for me, but I have spent days in preparation, reading documentation, guides and so on. Please use this article as an addition to all other stuff you should check before going live with this, especially in production environment.

Thanks for reading and see you next time…


Posted in ASA, Cisco, FirePOWER, FireSight, IPS, Security, Sourcefire | 11 Comments

Sourcefire Security Intelligence – DNS Policy

On July 2nd last year, we talked about Sourcefire Security Intelligence. Briefly, what it does is making use of huge collection of known bad IPs and blocking them before our users access them. In this collection we can find IPs categorized as Bots, Malware, Tor, C2, Phishing and so on. Why is this such a good idea? Well, if we know that some IP is malicious, we don’t bother wasting our time and resources in figuring out what is going on – we simply drop all communication to that IP. Cisco is maintaining this database of known bad IPs and we should make sure we update as often as possible.

Ok, that is a recap from the SI blog. Now we are going to talk about similar functionality, but on the DNS level. What does this mean? Well, Network Security Intelligence knows about bad IPs and block those. But DNS Security Intelligence does the same but instead of knowing about bad IPs and block them, it knows about bad names and block these names.

I believe that under the hood the Sourcefire is using OpenDNS database to make sure that bad domains get blocked. For those who don’t know, Cisco recently bought OpenDNS company for a boat load of money, in order to make a good product even better. OpenDNS is known for serving billions of DNS requests world wide and categorize these requests, similar to what network security intelligence does with IPs. This is a screen shot of the OpenDNS configuration web portal for home use:

15-Mar-16 10-00-26 AM

15-Mar-16 10-01-31 AM

We can see how easy it is to protect our home or small office from malicious content with just a few clicks and do that for free. Yes, for free! We need to register to OpenDNS and enlist our public IP address. If it is dynamic, there is a client that refreshes this entry when the address changes. The only thing left is making sure that our router serves OpenDNS DNS addresses to our clients, or clients are manually set to use those addresses. Now when a client resolves a name to an IP address, if the request contains malicious or otherwise forbidden name, the OpenDNS will return the IP address of one of its own web servers and we will be presented with a block page. How cute this is.

Guys from Cisco figured out that this concept could be applied to Sourcefire and corporate environments. How? Keep reading…

Now days, Security Intelligence or SI is divided into three categories:

  • Network Security Intelligence
  • DNS Security Intelligence
  • URL Security Intelligence

This time, we will discuss the DNS Security Intelligence. By default we have three objects and one policy pertaining to DNS SI. The objects are:

15-Mar-16 10-13-04 AM

  • Cisco-DNS-and-URL-Intelligence-Feed
  • Global-Blacklist-for-DNS
  • Global-Whitelist-for-DNS

First one is dynamic list maintained by Cisco. We can only choose how often we want this list to be downloaded:

15-Mar-16 10-17-50 AM

Second one is empty by default and is used for DNS names we don’t want ever to be resolved by our clients. This is something bad for us, but not for everyone else, and hence not in Cisco’s list. Or we are better in finding these names than Cisco 🙂

Third one is the list of names we don’t want to be blocked. Perhaps Cisco put something in dynamic list that we did not want to block.

The final piece of this puzzle is the DNS Policy. There is a default DNS policy called “Default DNS Policy” that is defined under “Policies->Access Control->DNS” and is ready to use. This policy by default uses only whitelist and blacklist and does not utilize any of dynamic bad categories:

15-Mar-16 10-29-06 AM

There are two rules in this policy. One rule with action Whitelist, which allows listed names to be resolved, and another rule with action “Domain Not Found“. If a DNS query is seen by Sourcefire with a name contained in this list, the Sourcefire will make the DNS response to be “Domain Not Found“. This action is exactly what we are going to setup for dynamic list. We click “Add DNS Rule“, give it a name and select the action:

15-Mar-16 10-34-17 AM

There are several options we can use for action:

  • Whitelist: allows matching traffic to pass and no log entry is generated
  • Monitor: don’t white/black list the traffic, just log an event
  • Drop: drop the traffic
  • Domain Not Found: return DNS not found response message to clients
  • Sinkole: return the IP address of a sinkole server we configured

Now we chose Zones, Networks, VLAN Tags as appropriate, and within the DNS tab, we select categories we want this action to apply to:

15-Mar-16 10-36-55 AM

Once we are done, a third rule within the policy appears:

15-Mar-16 10-38-00 AM

The rules have orders by which they get applied. So, white list is evaluated first, then black list and finally the dynamic feed.

Now we have to edit our Access Policy to make sure that the right DNS policy is applied. This is done under “Security Intelligence” tab:

15-Mar-16 10-41-59 AM

We could easily miss the option for logging DNS blocking events, that’s why I marked the log options icon.

After applying Access Control policy, we are ready to test this feature out. Under “Analysis->Connection->Security Intelligence Events” we can see that our policy is actually intercepting DNS requests and returning error messages to clients on behalf of DNS servers:

15-Mar-16 10-50-46 AM

If we click one specific event and scroll to the right, there should be a column called “DNS Query“, we can see what query looked like:

15-Mar-16 12-12-01 PM

If we want this name to be white listed or black listed, we right click it and select appropriate action:

15-Mar-16 12-14-18 PM

We don’t have to reapply any policies when adding something to the list, but we have to, when removing an entry.

If we now try to resolve the name, it will be successful and we can see that this name is actually white listed:

15-Mar-16 1-03-35 PM

To answer the question do we need DNS SI besides IP SI? Well, perhaps. It is possible that the IP address is not known at the time or is changing often, but the DNS name remains the same. So I guess this is another security tool under our security tool belt.

The URL Security Intelligence uses the same principle, but instead of working with IPs or DNS names, it uses URL links instead.

Thanks for reading.


Posted in Cisco, FirePOWER, FireSight, IPS, Security, Sourcefire | 13 Comments

Sourcefire Correlation Policy – Compliance White Lists

We should have in mind that the Sourcefire is not by any means a SIEM solution. This correlation thing is most powerful weapon of SIEMs, but with Sourcefire we have the also some capability to correlate different events. The main idea behind correlations is to tie several events together in order to make a decision on something in our network is acting bad or not. So, how does Sourcefire do that?

In our Defense Center or DC (I believe they don’t call it DC any more, but I just got used to it) we can create a Correlation Policy which will alert us if certain criteria is met. This criteria can be almost anything that our SFRs collected while doing a network discovery. We will see examples in just a second. A correlation policy consists of Compliance White List and/or Correlation Rules. The following diagram can help us understand the architecture of correlation policy.

diagram

As we can see, the policy can contain one or more compliance white lists and/or one or more correlation rules. There are one Default White List that is not assigned to any policy by default, but we can also create our own white lists, as we will see. By default there is also no rules in a policy, but we will create them as well.

Further down our diagram, we can see that the compliance white list, either default or custom, contains one or more Target Networks and Allowed Host Profiles tied to these networks. There is no point in having one but not the other. In fact, we won’t receive any violations if we don’t have both defined. This network-profile pair simply says what applications and protocols are allowed in what network. If the violation occurs – sound the alarm. For example, we can create a white list that contains a network 192.168.254.0/24 and we can specify through the host profile that on that segment we host only servers. So this is a server farm containing only web servers. Our host profile would state that in this segment is allowed only HTTPS as a server application and that only a Linux server is allowed. If somehow anything else appears in that segment, for example an attacker or a rogue admin installs a FTP server or begins surfing the web from that segment, an alert would be generated and an action would be carried out. Nice!

Our target network can be The Entire Network, which contains all hosts our DC knows about, or we can create a Custom Network and cover only hosts we want. The entire network is defined as 0.0.0.0/0, which means anything and is tied to default white list. If we wanted to create our custom server farm such as one from the paragraph above, we could give it a name and list 192.168.254.0/24 as the address space.

When it comes to the allowed host profiles, there are three types of those. Each type servers the same purpose but is used differently. We have Global Host Profile which defines any operating system. This profile is a member of any list we create and it does not specify any applications but rather only allowed protocols. This profile basically describes any network capable device. This host profile is recognized as being written in bold and called Any Operating System within a compliance white list:

Any Operating System

The second host profile type is Shared Host Profile. As the name implies, this profile can be shared among many white lists. We can create this profile or it comes predefined. If it is predefined, then it is listed under Built-in Host Profiles within a white list. These profiles are defined by Cisco and there are tons of them. Each of these profiles contains application categories that are typical for that host profile. For example, this is what makes typical Debian Linux:

Debian Linux HP

We can see that one Debian typically runs a DHCP server (really???), a SSH server and a FTP server. Further more, typical Debian does not run any client applications and we find all standard protocols on it (ARP, IPv4, IPv6, TCP, UDP and icmp). The predefined host profiles are distinguished with a small gift package icon next to its name. We can tweak these profiles and revert them back to their defaults if we are not satisfied with modifications we made. I would most likely remove the DHCP server from Debian profile, but that’s just me 🙂

We can define our own host profile. This can be done manually, when we define such and such applications, or we can find some host already known by network discovery process and make it a shared profile. For example, a specific Windows machine is selected to represent a host profile called pop-400g2 and this host profile is based on the network analysis process which identified this PC as a Windows 7/8 with applications that are identified at the time the profile is created:

pop hp 1

pop hp 2

pop hp 3

At the time this blog is written, no Windows 10 OS host profile existed.

Finally, there are Operating System Specific host profiles which describes what apps a certain OS should run. Debian from the above paragraph is actually an OS host profile. A shared host profile is actually a OS specific host profile.

To sum up, each compliance white list should have a target network, which describes a portion of our network that has some significance to us, and allowed host profiles that can contain elements that belong to one of four sections:

  • Allowed Application Protocols – contains server side applications, such as RDP or SSH
  • Allowed Clients – applications that run on a client PC, such as web browser
  • Allowed Web Applications – applications that uses a HTTP protocol (Gmail, Linkedin)
  • Allowed ProtocolsARP, IPv4, IPv6, TCP, UDP or IPX

Now when we know everything about compliance white lists, let’s create a scenario. We want to pay attention to a network segment 10.0.0.0/24. This segment has some importance to us. We will create a custom white list that will have this segment as a target network with all operating systems detected by network discovery process so far. Then we will assign this white list to a custom correlation policy. Finally, we will plug in in that segment a PC that should not be there and see violation triggers. Let’s go…

First, let’s define our white list. Under Policies->Correlation->White List, we click New White List from the top right corner. First we fill the target network in:

add target netwok 1

If we just click  Add here, we will have to specify allowed protocols and applications  manually. This can do the trick, but it is time consuming and we want to make use of the network discovery process ran so far to fill these for us. So we click Add And Survey Network. We give this list a name and we can see that we already have our allowed host profiles filled in:

add target netwok 2

We have to have in mind  that there is no network scanning process involved in this step. The operating systems we see in this segment are result of the network discovery process running up to this point. This process discovered operating systems above. We make note that there is no Windows server listed here. When we are done with the testing, the server still won’t be listed here because it will be detected as Windows7/8, but if we pluged in one HP-UX server, for example, it would show up here. Let’s pretend that the Windows server  is forbidden in this segment. We will introduce one later and provoke a compliance violation. For now we click Save White List.

Now we create our correlation policy and assign this white list to it. Under Policies->Correlation->Policy Management we click Create Policy. We give it a name and click Add Rules to assign correlation rules or white lists to this policy. We will deal with the correlation rules in the next blog post, so for now we just assign a white list to this policy:

available rules 1

We select our list and click Add. Before we save this policy, we should have in mind that we can assign an action to the violation event. By default only an alert will be logged to the DC, but we can run certain actions, such as send an email, SNMP trap, send the message to SIEM or even try blocking such events. For now we will specify no further actions, so we click Save to save policy. Important thing about correlation policies is that we don’t have to attach it to anything. They are active as soon as we save and activate them by clicking Activate icon on the right. Here we can see one active and one inactive policy:

active inactive

As soon as we activate policy it is running and waiting for violation to occur. So, let’s introduce a Windows server 2012R2 into network…

Once we place this server in this segment a violation occurs which can be observed by going to Analysis->Correlation->White List Violations:

violation 1

Here we can see a server called w2012r2.popravak.local with the IP address 10.0.0.135. Now, if we select this server and click View, we will see all events that violates the policy:

violation 2

Now we select one event and click View again to drill down in more details:

violation 3

We can see here details about this host and with a black exclamation mark is marked a protocol or application that violated our policy.

If we go to Analysis->Correlation->White List Events, we can see the actual reason for this violation:

violation 4

If in this segment a Windows PC  appears with, for example, VNC protocol on it, this will also be reported as a violation, because this protocol is not allowed as per our white list specification:

violation 5


violation 6

If these Windows server and Windows PC stay here and policy sticks, we will see more and more violations as they are being discovered.

The violation can occur for number of reasons including:

  • when the OS changes
  • when a new TCP/UDP server port is detected
  • after an upgrade of a server application
  • new client or web application is spotted on a host
  • client or web application is removed from a database
  • new network or transport protocol is detected
  • jailbroken device is detected
  • we add application, server or protocol to a host
  • we delete application, server or protocol from host
  • we change OS definition for a host
  • we change one or more attributes for a host

Next time we will see the other part of correlation policy which are correlation rules.

Thanks for reading.


Posted in ASA, Cisco, FirePOWER, FireSight, IPS, Security, Sourcefire | Tagged , , , , | 7 Comments

2015 in review

We had about 200,000 views in 2015. Thanks guys for making this number possible. All the best in 2016 in professional and personal life. See you soon in new blog posts. Cheers!

The WordPress.com stats helper monkeys prepared a 2015 annual report for this blog.

Here’s an excerpt:

The Louvre Museum has 8.5 million visitors per year. This blog was viewed about 200,000 times in 2015. If it were an exhibit at the Louvre Museum, it would take about 9 days for that many people to see it.

Click here to see the complete report.

Posted in Uncategorized | Leave a comment